This week, we talk about counterintuitive user experiences that designers regularly design for in our day to day work. Let us know what we missed! As always, we catch up on feedback, tweets, and share our cool things of the week: a blog post explaining how to polish an interface, and a YouTube series about first-time reactions.
Golden Ratio Patrons:
We're looking for partners to work with. If your team is hiring, launching a new product, or wants us to get the word out about a new initiative, please get in touch!
Latest VIP Patrons:
Huge shoutouts to our latest Very Important Pixels!
- Rodrigo Antonio DeLima
- Arkadiusz Bartnik
- Hello Hill
- Steffie
- Elvin Hu
- Daniel
- Mark McEwan
Follow-up:
Tweets:
- Thijs Bremeesch thinks our podcast is GOLD. We like gooooold.
- Elvin says we're contributing to ongoing sanity – glad we can help a tiny bit!
- Ben Dunn is a new fan from New Zealand - welcome to the pod!
- Katarina Blind says last week's episode made her day. Katarina also bumped us up to $1.28 on the Patreon – you're the best!
News:
- Apple accidentally leaked AirTags, hopefully coming soon!
Listener Question:
- Paweł Sysiak asks: "Could you list some examples of common mistakes when creating experiences? What are some UX mistakes that are counter-intuitive and prevalent?"
- Stateful icons
- Two choices on leaf pages
- Primary actions placed in a navigation bar, which are harder to reach
- Samsung's One UI is doing an interesting job of moving actions closer to the bottom of the screen.
- The HIG recommends placing destructive actions far away from a person's fingers.
- People don't read full screen interstitials
- The introduction of change is as important as the change itself
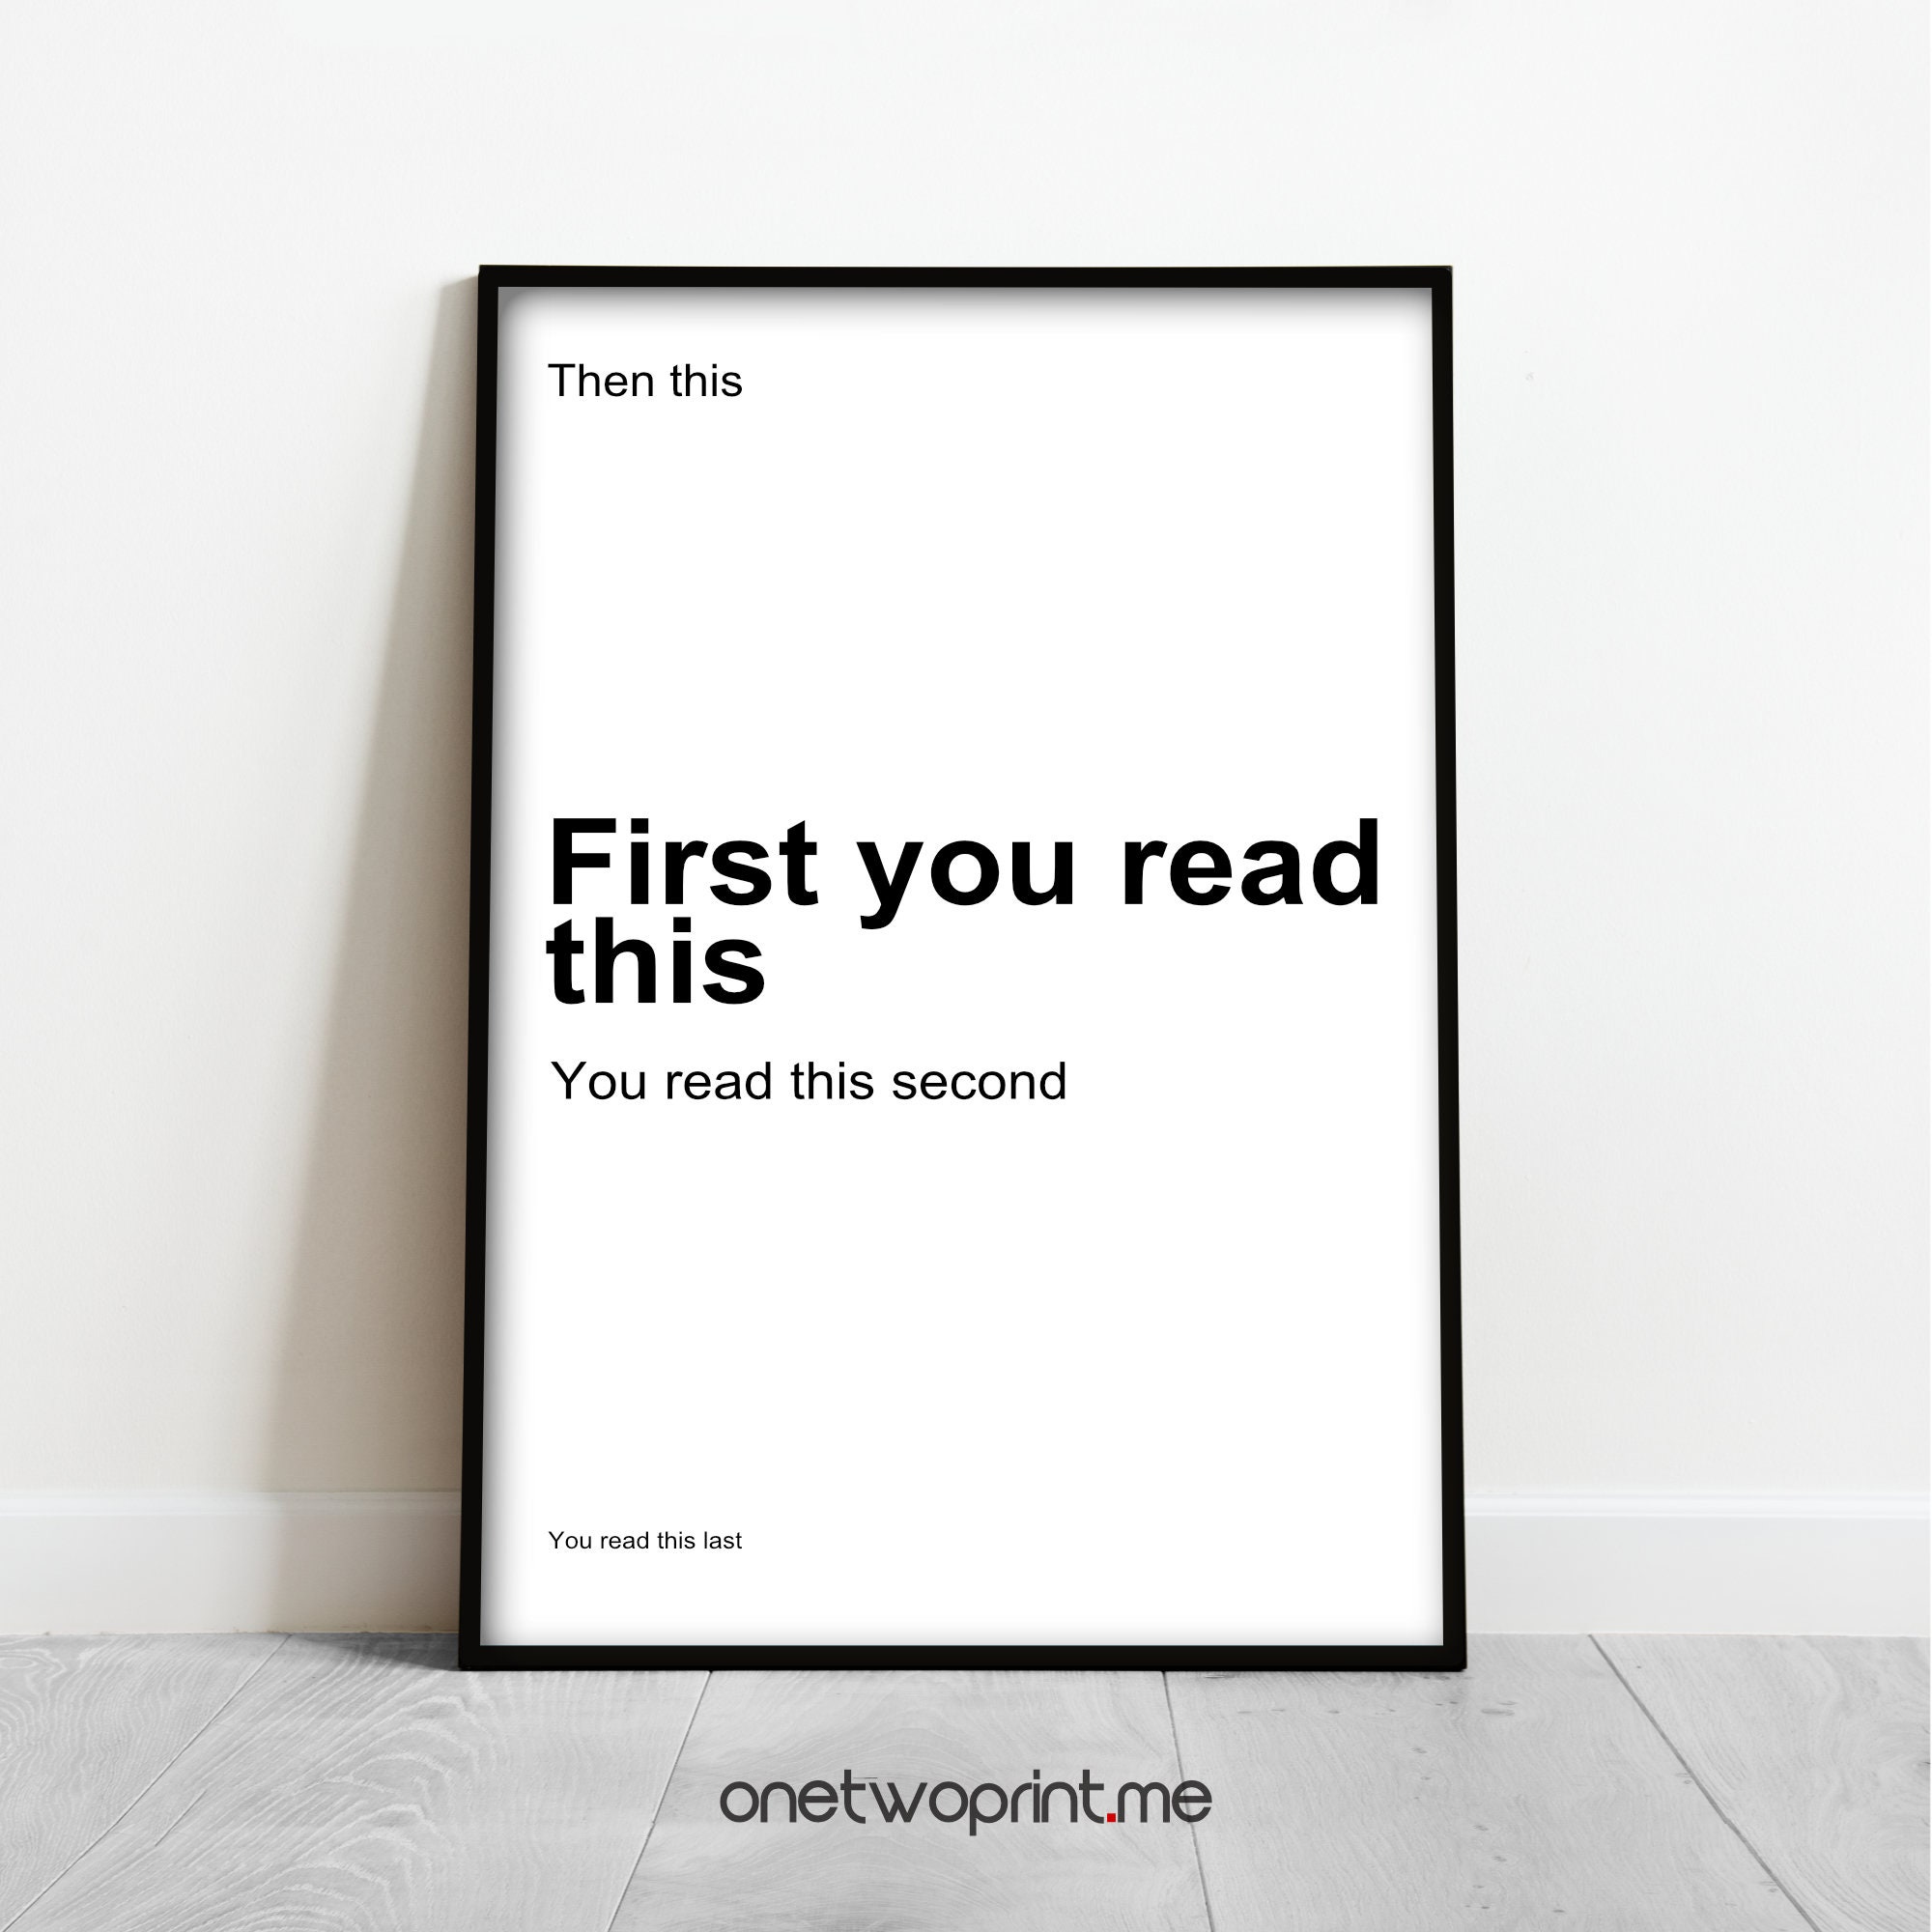
- Typographic hierarchy overrides structural hierarchy
- Buttons are better than gestures
- Iconography and colors aren't universal
- Data visualization colors should vary by brightness, not hue
Cool Things:
- Brian shared Cleaning up form UI, a blog post by @nikitonsky which describes step by step how to polish an interface using grids, spacing, typographic hierarchy, and color.
- Marshall shared Holden Hardman's YouTube series, My Friend Watches. In this series of video, Holden introduces a friend to new movies and captures the reactions for the internet to enjoy.
Design Details on the Web:
WASH YA HANDS!


